From mid January until mid March 2019 Netwerk Democratie along with Framer Framed co-organized Broadcasting from Babylon (BFB), a public program initiated by Amal Alhaag and Maria Guggenbichler as part of the master programme of DAS Graduate School. The public program series explored and focused on intersectional feminist, queer, and anti-colonial embodied, listening and sounding practices. As part of the program Netwerk Democratie organized a series of seven workshops on the topic of Citizenship and Cultural Production every Thursday (January 24 – March 7). On February 21st one of these sessions was on the topic of creative coding and plotting data held in the DAS Graduate School in Amsterdam Noord. In case you missed it, here is an overview of what was explored and discussed during the seminar.
Written by Rimma Samir
What can and does one imagine when one puts words ‘coding’, ‘creativity’, and ‘(artistic) performance’ into the same context? How can data be used in artistic practices? And lastly, how can we reimagine the performativity of the dataset?
Answers to the questions posited above were diligently presented, explored and deliberated upon by Cristina Cochior and Ruben van de Ven along with the participants of the seminar. Before delving into what has been discussed, let us first get to know the seminar leaders. Cristina is a researcher and designer interested in structures of knowledge co-production, politics of automation, archival representation, open access publishing, and situated software practices. Ruben is a digital artist and researcher of software culture with a particular interest in digitalization of behavior and emotions. In 2016 they started a collaboration with Eye Without A Face – an algorithmically produced video based on footage from the archive of the Eye Film Institute. Their current project is called Plotting Data, collaborative research on the affective properties of data structuring and visualization.
During the event we explored ways in which coding/data and creativity can be interlinked. Let’s start by stating the obvious that with the number of educational resources and APIs available anyone with a computer and access to the Internet can learn how to program. But what does this ability to program entail and what does it afford its owner? According to Cristina and Ruben, it allows to “free yourself from pre-existing tools” and provides the programmer with an ability for experimentation. This uninhibited ability and freedom can consequently be used to make art and showcase artistic performance. For instance, the Pathfinder project by Waltz Binaire is a visual language that consists “of a set of reduced graphical primitives which are progressively transforming”. This software allows to graphically embody the live choreography of dancers, thus “generating a vast number of geometric inspirations, allowing the dancer to generate any number of interpretations and embodiments”. In addition to software such as Pathfinder, there exist a multitude of ways in which one could create a live performance piece (such as this one) through code.
Although in the recent years there has been a lot of friction around the topic of algorithms and their inherent biases, what stands behind algorithms, namely, the data and its deemed ‘neutrality’ have not been contested to the same degree. Arguing in favor of coming back to the inherent biases pertaining to data and processes that surround it, Cristina and Ruben have shared their knowledge on the different type of biases that can pertain to data by giving examples of meaningful data sets (or lack thereof).
These are the biases that hide behind our mistaken perception of data neutrality:
- Historical bias (can be seen in predictive policing algorithms)
- Collection bias (occurs when a dataset is collected in a way that some data points are less likely to be included than others)
- Aggregation bias (occurs when data is aggregated with its applicability to individual cases in mind, despite the fact that it does not necessarily have to apply to every individual)
- Evaluation bias (depends on prior assumptions of the researcher/data analyst and their relation to the outcomes of the research)
During the workshop, various instances of data biases were covered. This was done in order to forge a general understanding of a variety of ways in which data can be subjective. One specific instance of data bias is one in policing algorithms. What can often be observed in such software that certain neighborhoods of the city light up indicating that they would be the place where most crimes are expected to happen. Logically, those neighborhoods then see a rise in the amount of police personnel. Since there is more police on the streets of that particular part of the town, “more crime is going to be registered [there] because there are more eyes to register it”, says Ruben. This leads to a loop that, in some cities, reinforces societal and racial bias, along with socio-economic challenges.
PlottingD.at/a Project
The main purpose of the seminar to take place was to showcase that datasets, which become bases of algorithms are not “distilled versions of reality”. For this reason, Cristina and Ruben’s most recent collaborative project Plotting Data (http://plottingd.at/a/) focuses on transparency of underlying procedures of data collection. According to the project’s webpage “as any technology, datasets encode their goal, their purpose and the world view of the makers. And as parameters which a social environment is boxed into strongly determine the system’s application and representation, data collection is political.” Ruben and Cristina argue in favor of fostering data literacy, which would bring about public understanding of data infrastructures that are not readily available within the non-specialized communities.
The way that Ruben and Cristina have chosen to foster data awareness and knowledge across to their audiences was through data dramatization, which was the final part of the seminar.
Data Dramatization, as opposed to data visualization presents a data set with not only legibility or clarity but in such a way as to provoke an empathetic or emotive response in its audience. – Liam Young, author who coined the term
Whereas visualization is often used to create a deeper understanding of the data, dramatizing it can potentially be more efficient in reaching the goal since it imbues datasets with levels of emotional attachment. When data is dramatized it ceased to be an ‘objective’ representation of a particular facet of the world, instead, a light is shed onto its place in the overarching narrative saturated with political, historical, personal, and emotional components.
So, how exactly does the dramatization process work? According to Memo Akten, the first step in the process of data dramatization is its understanding, which happens through analyzing, playing around with it, exploring relationships engrained in it, inferring what events have taken place, and, lastly, extracting stories and meaning. The second step of dramatization is creating something completely new “inspired by those same underlying principles and processes that you’ve just learned”. During the seminar, the participants were given a text, which was used as a tool to explain how text generating algorithms depend on the data. Afterward, the participants were tasked with generating their own text using the logic of the n-gram algorithm in order to comprehend how the machine operates without opening the computer. Through such exercises bias inherent to any data (which algorithms are based upon) can become more comprehensible to a crowd not versed in software design and development.
An interesting example of data dramatization mentioned during the seminar was Mimi Onuoha’s project called ‘Missing Datasets’. In this project, the artist problematizes the word ‘missing’ since in her opinion it is inherently normative. As Cristina explains, “even if something is missing it does not necessarily mean that it should be there, but that its absence should be acknowledged”. In this project, Mimi has created a repository of missing datasets, which she keeps gradually updating in order to showcase data that “have been excluded in a society where so much is collected”. On her Github page, the artist argues that such lack of data “typically correlates with issues of those who are the most vulnerable in that context”.
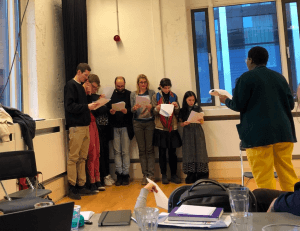
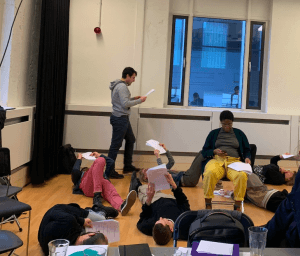
The last exercise that visitors of the workshop were able to join was designed by Amy Pickles, an artist who arranged a theater play using the emails of workers of the infamous Enron. The aforementioned organization was a booming energy, commodities, and services company based in the United States. However, it suddenly went bankrupt in 2001 and several of its employees have even gotten incarcerated as a result of fraud allegations. In the process of the lawsuit, the Financial Watchdog leaked a dataset of seven hundred thousand emails as proof in the case. This leak was the first instance private content of such scale was released on the Internet. The participants of the seminar were able to enact the play based on emails sent by one of the Enron workers over a certain period of time. According to Cristina, those “emails have something special about them. There is this materiality that is not visible from the text that is bound by time and space”. Through enacting the contents of the emails, the participants were able to somewhat grasp that materiality, observing that data is not objective.
We live in a society which becomes more and more dependent on technological developments. Therefore, keeping up with and understanding the processes and structures that underlie the technologies that we use on a daily basis becomes a question of societal and personal safety. If we do not comprehend what is being done behind algorithms that permeate all levels of our life, we create a space for abuse of that power. Hence, the work of researchers like Cristina Cochior and Ruben van de Ven is intrinsic.

